Enterprise-Grade Monitoring & SIEM for a Homelab - From Zero to 52 Alert Rules
TL;DR
I built a production-grade monitoring and SIEM platform for my entire homelab infrastructure running on a single-node K3s cluster. The system combines Prometheus for metrics, Grafana for visualization, Loki for log aggregation, and Wazuh for security event management — all deployed via Ansible and Helm with full Infrastructure as Code.
Key Metrics:
- 42 Prometheus scrape targets
- 33 custom Grafana dashboards + 10 community imports
- 52 custom alert rules with intelligent inhibition
- 22 Wazuh security agents across 3 OS families
- 8 agent groups with specialized detection rules
- ~100 custom Wazuh rules (IDs 100100–100499)
- 3 Wazuh Grafana dashboards (SIEM, Compliance, Vulnerabilities)
- 14-day log retention in Loki
- Multi-tier alerting: Email + ntfy mobile push
Why Build Enterprise Monitoring for a Homelab?
Many homelabs run blind. Services crash, disks fill up, certificates expire, and you only notice when something stops working. I wanted the opposite: know about problems before they become outages.
Three goals drove the implementation:
Visibility: Every host, every service, every metric — in one place. From GPU temperature on the AI VM to battery charge on the UPS, from LoRaWAN sensor signal strength to Proxmox guest status.
Security: Running 20+ hosts with internet-facing services demands real intrusion detection, not just hoping firewalls are enough. Wazuh provides file integrity monitoring, vulnerability scanning, and active response across the entire fleet.
Automation: No manual log checking, no SSH-ing into boxes to check disk space. Alerts come to my phone. Dashboards show the full picture. Problems get detected and — in some cases — resolved automatically.
Architecture
The monitoring stack runs entirely within the monitoring namespace on a single-node K3s cluster, while Wazuh operates as an All-in-One LXC container on Proxmox. Both systems feed into the same Grafana instance.
Infrastructure:
| Component | Location | Role |
|---|---|---|
| Prometheus | K3s Pod | Metrics collection, 15-day retention, 15Gi storage |
| Grafana | K3s Pod | Visualization, 33+ custom dashboards |
| Loki | K3s Pod | Log aggregation, single-binary, 14-day retention |
| Alertmanager | K3s Pod | Alert routing, email + ntfy |
| Promtail | K3s DaemonSet + external agents | Log shipping from pods, PVE hosts, Wazuh |
| Wazuh Manager | LXC on Proxmox | SIEM: Manager + Indexer + Dashboard |
| 8 Exporters | K3s Pods | PVE, UniFi, Blackbox, SNMP, NUT, PBS, AdGuard, Speedtest |
Deployment Method:
| Stack | Tool | Source |
|---|---|---|
| Prometheus + Grafana + Alertmanager | Helm (kube-prometheus-stack) | kubernetes/monitoring/install.sh |
| Loki + Promtail | Helm | kubernetes/monitoring/install.sh |
| All exporters | Kustomize | kubernetes/monitoring/<exporter>/ |
| Wazuh Manager | Ansible | ansible/playbooks/configure-wazuh-manager.yml |
| Wazuh Agents | Ansible | ansible/playbooks/setup-wazuh-agents.yml |
| External monitoring agents | Shell scripts | scripts/setup-monitoring-hosts.sh |
Everything lives in a single Git repository — true Infrastructure as Code with Ansible playbooks for Wazuh and Helm/Kustomize for Kubernetes workloads.
The Monitoring Stack
Prometheus: 42 Scrape Targets
Prometheus sits at the center, scraping metrics from every layer of the infrastructure. The configuration in values.yaml defines 42 jobs organized by category:
Infrastructure Hosts (7 targets):
| Target | Host | Port | Interval |
|---|---|---|---|
| pve-nodes | 3 Proxmox hypervisors | 9100 | 30s |
| ai-vm | AI/GPU VM | 9100 | 30s |
| relay | Mail relay LXC | 9100 | 30s |
| opnsense | Firewall | 9100 | 30s |
| smartctl | Storage host | 9633 | 300s |
API Exporters (8 targets):
| Target | What It Monitors | Port | Interval |
|---|---|---|---|
| pve-exporter | Proxmox API (all VMs/CTs) | 9221 | 60s |
| pbs-exporter | Proxmox Backup Server | 10019 | 60s |
| unifi-poller | UniFi Controller (APs, clients) | 9130 | 30s |
| snmp-switch | D-Link switch | 9116 | 60s |
| snmp-truenas | TrueNAS SNMP | 9116 | 60s |
| nut-exporter | Eaton UPS (battery, load) | 9199 | 30s |
| adguard-exporter | AdGuard DNS analytics | 9618 | 30s |
| speedtest | Internet bandwidth (every 4h) | 9798 | 300s |
Service Health Probes (Blackbox Exporter):
| Probe Type | Targets | Module |
|---|---|---|
| ICMP Ping | 21 hosts (all infrastructure) | icmp_ping |
| HTTP 2xx | 12 internal services | http_2xx |
| HTTP Any | OPNsense (Let’s Encrypt) | http_any |
| DNS | OPNsense Unbound | dns_test |
| SMTP | Internal mail relay | smtp_relay |
Application-Specific (20+ targets):
GitLab alone exposes 5 scrape targets (exporter, webservice, gitaly, postgresql, redis). Additional targets include Traefik ingress metrics, cert-manager certificate lifecycle, Cloudflare Tunnel stats, ChirpStack LoRaWAN, MQTT sensor exporter, NVIDIA DCGM GPU metrics (15s interval!), Home Assistant, Wazuh SIEM exporter, and external services like the portfolio chatbot API with bearer token authentication.
The full target list reads like a network inventory — because it essentially is one.
Grafana: 33 Custom Dashboards
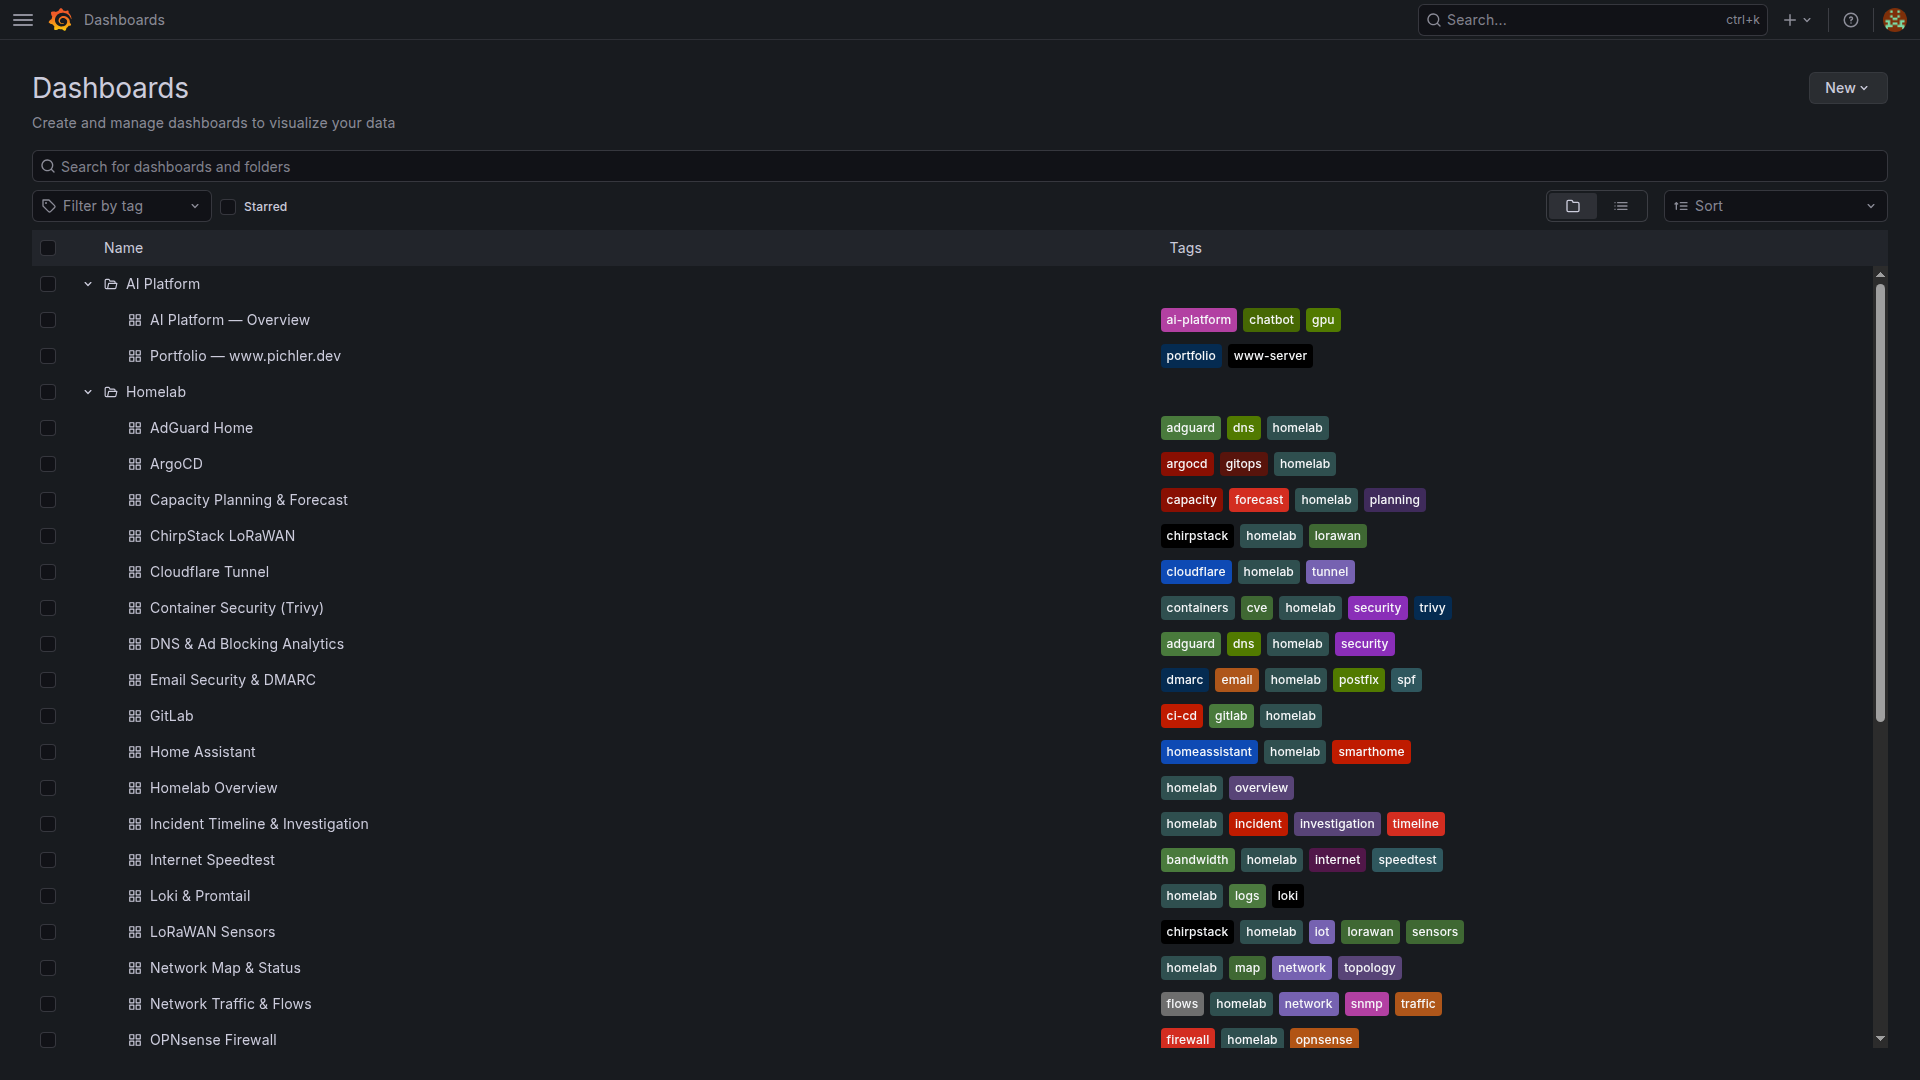
Every dashboard is deployed as a Kubernetes ConfigMap with the grafana_dashboard: "1" label, automatically discovered by Grafana’s sidecar. No manual import, no clicking through UIs — git push deploys dashboards.
Custom Dashboards (ConfigMap-based):
| Dashboard | Key Panels | Data Source |
|---|---|---|
| Homelab Overview | Service status grid, host health, quick links | Prometheus |
| Wazuh SIEM | Agent fleet, alert categories, top rules | Prometheus (Wazuh exporter) |
| Wazuh Compliance & Threats | SCA scores, MITRE ATT&CK tactics, auth events | Prometheus |
| Wazuh Vulnerability Deep Dive | CVE counts by severity, per-host breakdown, trends | Prometheus |
| AI Platform Overview | GPU temp/utilization/VRAM, inference latency | Prometheus-AI |
| Portfolio www.pichler.dev | HTTP probe phases, SSL expiry, Docker metrics | Prometheus |
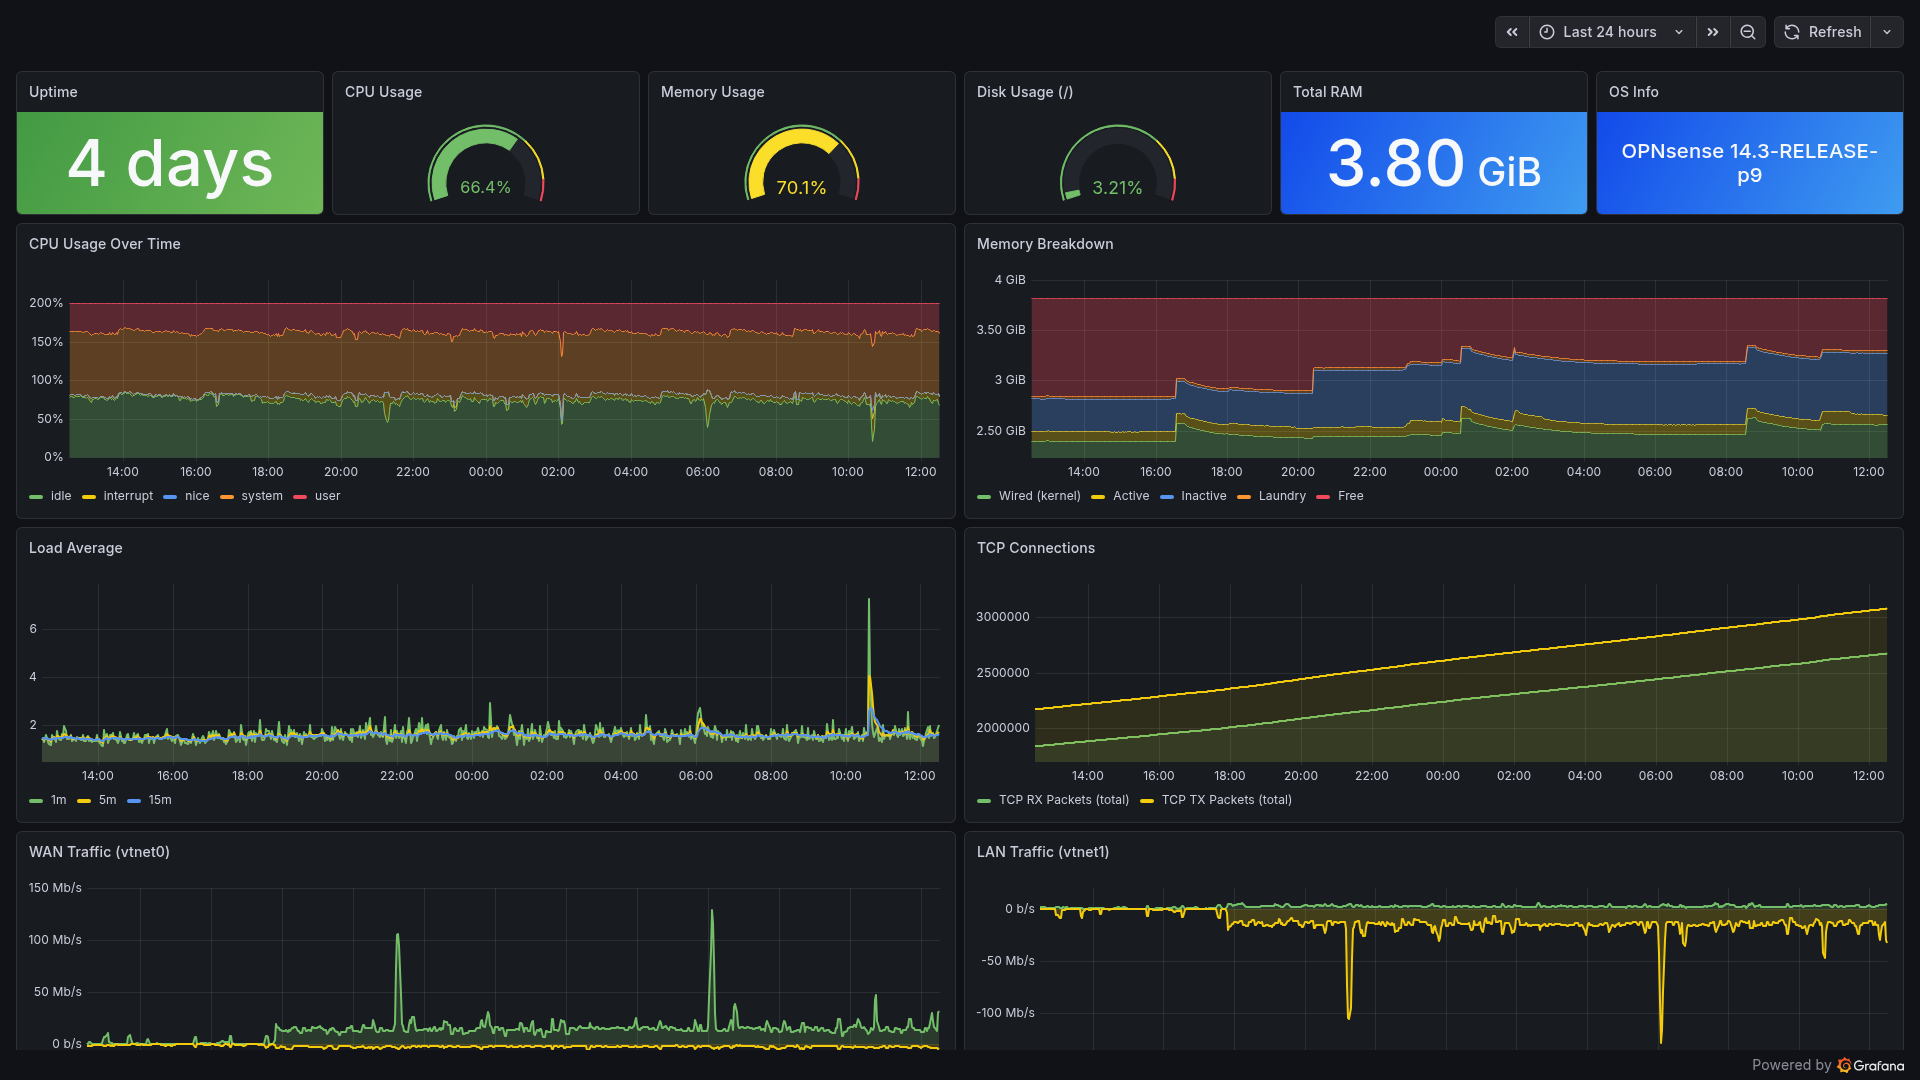
| OPNsense Firewall | Interface throughput, packet stats, rules | Prometheus |
| PBS Backup | Backup/verify age, datastore usage, job status | Prometheus |
| SMART & ZFS Health | Disk temperatures, pool status, error counts | Prometheus |
| NUT UPS | Battery charge, runtime, load, input voltage | Prometheus |
| Traefik Ingress | Request rate, latency percentiles, error codes | Prometheus |
| Loki & Promtail | Ingestion rate, query latency, dropped logs | Prometheus + Loki |
| LoRaWAN Sensors | Battery %, RSSI, SNR, last seen | Prometheus |
| Power Cost & Energy | UPS consumption → €/month estimation | Prometheus |
| SLO & Uptime Tracking | Service availability percentages | Prometheus |
| Network Map & Status | L2 topology, link utilization | Prometheus |
Plus 10 community dashboards imported by gnetId:
| Dashboard | gnetId | Purpose |
|---|---|---|
| Node Exporter Full | 1860 (rev 42) | Comprehensive host metrics |
| Proxmox VE Cluster | 10347 | VM/CT overview |
| UniFi Client/UAP/USW/Sites | 11315/11314/11312/11311 | Network analytics |
| Blackbox Exporter | 7587 | Probe results |
| MinIO | 13502 | Object storage |
| SNMP Stats | 11169 | Switch metrics |
| cert-manager | 20842 | Certificate lifecycle |
Alertmanager: 52 Custom Rules with Smart Routing
Alerts aren’t useful if they wake you up for non-issues. The alerting system uses inhibition rules to suppress noise — if a host is down, don’t also alert about its services being unreachable.
Alert Groups (20 categories, 52 rules):
| Group | Rules | Examples |
|---|---|---|
| host-alerts | 11 | HostDown, HighCPU, HighMemory, DiskSpaceCritical/Warning, SmartDiskErrors |
| service-alerts | 5 | ServiceDown, SlowResponse, SmtpRelayDown, DnsDown |
| ups-alerts | 3 | UpsOnBattery (immediate!), UpsLowBattery, UpsBatteryReplace |
| kubernetes-alerts | 2 | K3sNodeNotReady, PodCrashLooping |
| wazuh-alerts | 4 | WazuhManagerDown, AgentDisconnected, HighCriticalCVEs, AlertSpike |
| gpu-alerts | 4 | GPUHighTemperature, GPUCriticalTemperature, GPUMemoryHigh |
| backup-alerts | 4 | PbsBackupStale, PbsVerifyStale, K3sBackupStale |
| certificate-alerts | 2 | CertExpiringSoon (30d), CertExpiryCritical (7d) |
| chatbot-alerts | 3 | ChatbotAPIDown, HighErrorRate, HighResponseTime |
| lorawan-alerts | 2 | LoRaSensorOffline (>2h), LoRaSensorBatteryLow (<15%) |
Inhibition Logic (5 rules):
HostDown         → suppresses all warnings for that host
UpsOnBattery     → suppresses non-critical alerts
DiskCritical     → suppresses DiskWarning (same mountpoint)
CertCritical     → suppresses CertWarning (same instance)
DiskFill3Days    → suppresses DiskFill7Days
Notification Routing:
| Severity | Channel | Timing |
|---|---|---|
| Critical | Email + ntfy push | Immediate, repeat 7d |
| Warning | ntfy push only | No repeat |
| UpsOnBattery | Email + ntfy | group_wait: 0s, repeat: 5min |
| Info | Silence | Dashboard only |
The ntfy-bridge is a custom Python service that translates Alertmanager webhooks into ntfy push notifications with priority mapping. Critical alerts get priority 5 (urgent), warnings priority 3 (default), and resolved notifications priority 2 (low). Separate topics for homelab-critical and homelab-warnings keep the notification channels clean.
Loki: Centralized Log Aggregation
Loki runs in single-binary mode — all components in one pod. For a homelab, this is the sweet spot between simplicity and capability.
Log Sources (3 tiers):
Tier 1 — K3s Pods (Promtail DaemonSet):
All pod logs from /var/log/pods are automatically collected with Kubernetes label enrichment. Zero configuration per service.
Tier 2 — PVE Hosts (External Promtail agents):
Installed via scripts/install-node-exporter.sh --with-promtail on pve1, pve2, pve3. Ships syslog, auth.log, pveproxy, pvedaemon, kernel, and systemd journal to Loki’s NodePort (31000).
Tier 3 — Wazuh Manager (Dedicated Promtail): The most interesting source. Promtail on the Wazuh LXC ships:
| Log Source | Format | Content |
|---|---|---|
| wazuh-alerts | JSON | Security alerts with rule IDs, severity levels |
| wazuh-manager | Text | Manager operational logs (ossec.log) |
| active-responses | Text | IP blocks, firewall drops |
| wazuh-api | Text | Dashboard/API access logs |
| syslog + auth | Text | System and authentication events |
| systemd journal | Structured | Service lifecycle events |
This creates a powerful correlation capability: Prometheus shows you what is happening (metrics), Loki shows you why (logs), and Wazuh shows you who is responsible (security events).
Configuration:
# Loki retention
limits_config:
  retention_period: 336h  # 14 days
  max_query_series: 50000
  ingestion_rate_mb: 10
  ingestion_burst_size_mb: 20
  max_streams_per_user: 10000
External Host Monitoring
Not everything runs in Kubernetes. The PVE hypervisors, OPNsense firewall, and Wazuh LXC need monitoring agents installed directly.
Installation:
# One script to rule them all
./scripts/setup-monitoring-hosts.sh

# Installs on pve1/2/3:
#   - node_exporter (port 9100) — CPU, RAM, disk, network
#   - promtail (log shipping to Loki NodePort)
# Installs on pve3 additionally:
#   - smartctl_exporter (port 9633) — SMART disk health
OPNsense uses its native os-node_exporter plugin — installed via System → Firmware → Plugins. No SSH needed.
TrueNAS and MinIO expose Prometheus endpoints natively — just enable in their respective UIs.
Wazuh SIEM: Security for Every Host
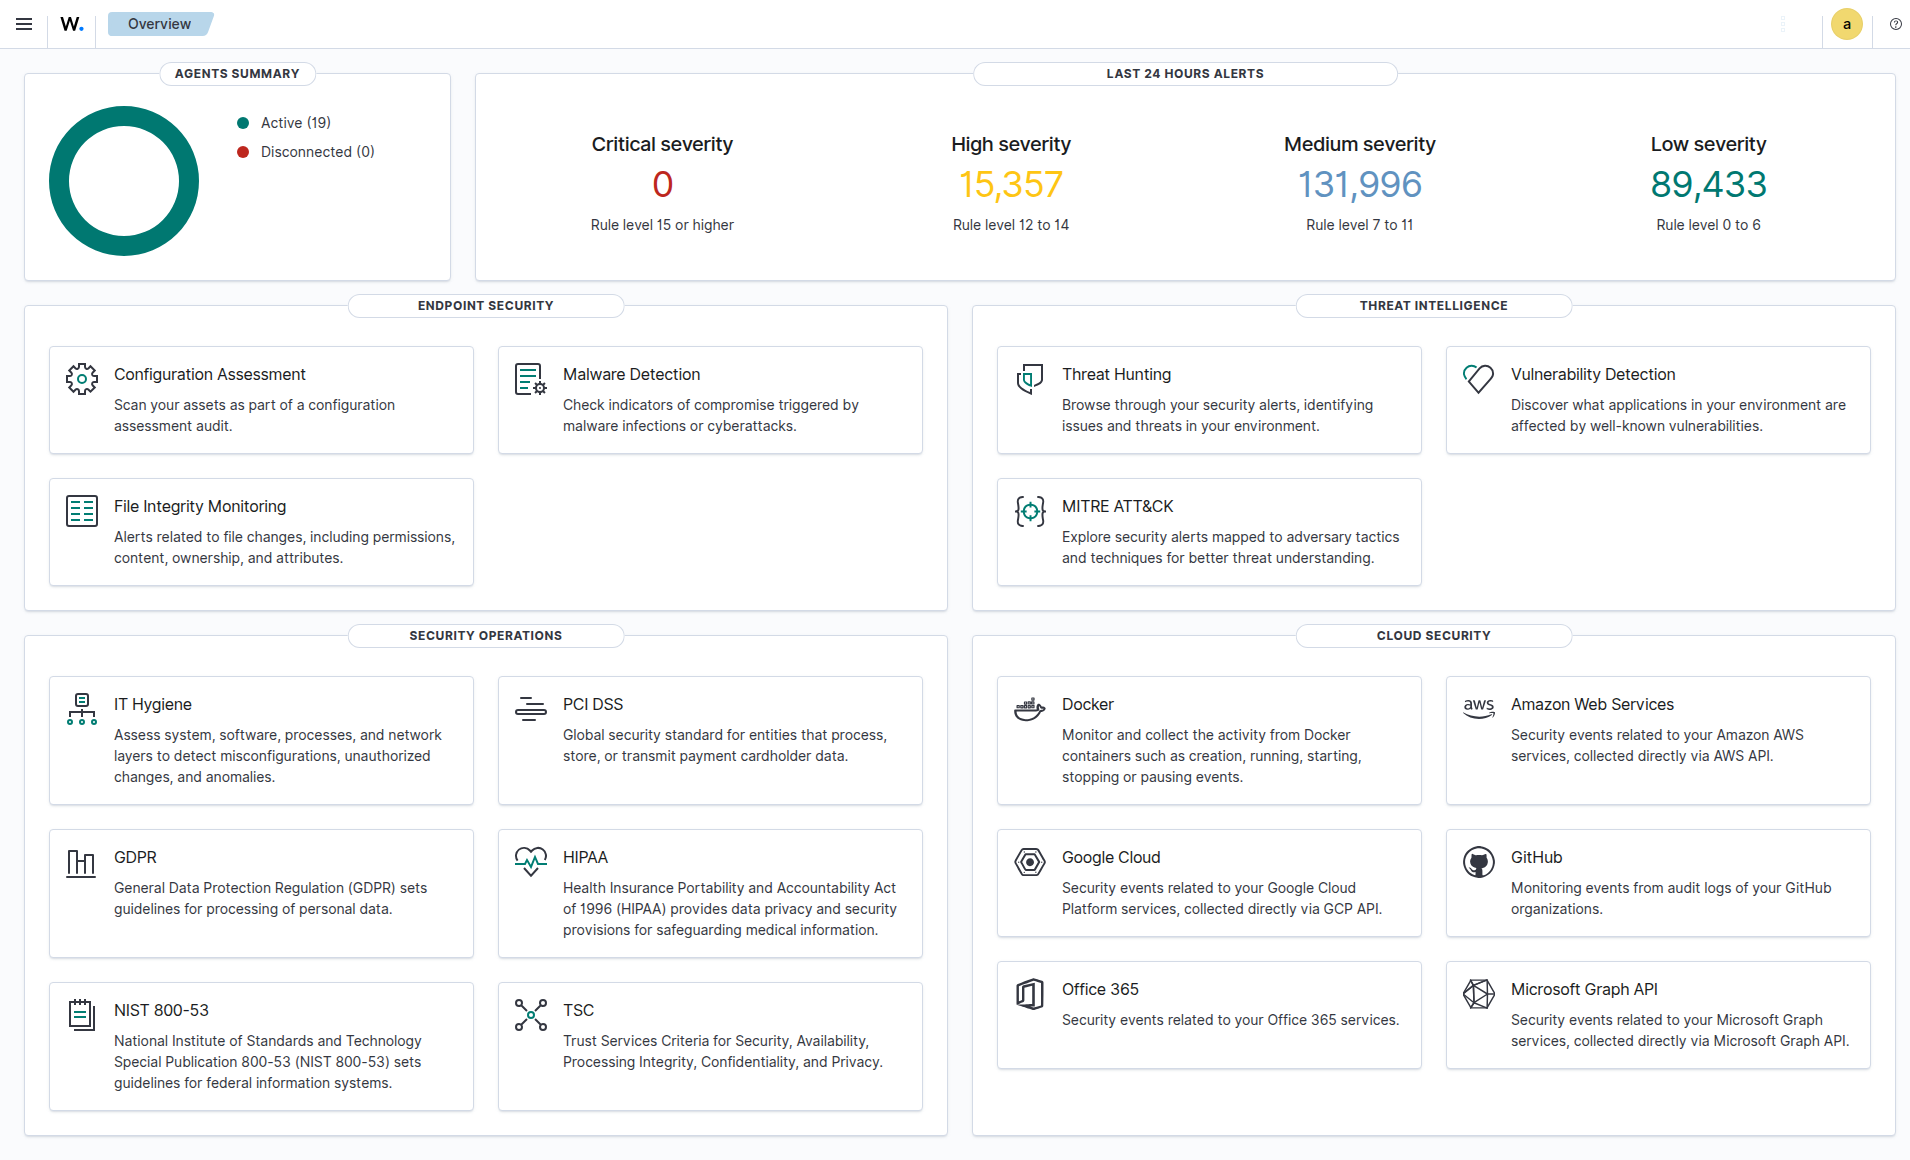
Why Wazuh?
Open-source SIEM that combines log analysis, intrusion detection, file integrity monitoring, vulnerability detection, and active response in one platform. For a homelab with internet-facing services, this isn’t optional — it’s essential.
Deployment: All-in-One LXC
| Property | Value |
|---|---|
| Platform | LXC on Proxmox |
| Resources | 4 vCPU, 6GB RAM, 50GB Disk |
| Version | Wazuh 4.14.3 |
| Components | Manager + OpenSearch Indexer + Dashboard |
Deployed and configured entirely via Ansible:
# Deploy agents to all Linux hosts
ansible-playbook -i inventory.yml playbooks/setup-wazuh-agents.yml

# Configure Manager (groups, rules, active response, email)
ansible-playbook -i inventory.yml playbooks/configure-wazuh-manager.yml
Agent Fleet: 22 Agents, 8 Groups
Every host in the homelab runs a Wazuh agent. Agents are organized into groups with tailored configurations:
Agent Groups:
| Group | Agents | Specialization |
|---|---|---|
| proxmox | 3 hypervisors | Hypervisor config monitoring, /etc/pve FIM |
| kubernetes | K3s node | K3s audit logs, K8s events, pod status, containerd |
| storage | 4 storage hosts | Backup configs, ZFS settings, storage credentials |
| network | 3 network services | Network service configs, Docker listener |
| services | 10 agents | Docker lifecycle, Nginx logs, service configs |
| ai-workload | GPU VM | Ignores large model files (.gguf, .safetensors) |
| windows | 1 Windows host | Windows Event Logs, Sysmon (pending deployment) |
| siem | Wazuh (self) | Self-monitoring: Manager, Dashboard, OpenSearch configs |
Each group has its own agent.conf in ansible/files/wazuh/shared/<group>/, defining:
- FIM (File Integrity Monitoring): Which paths to watch in realtime vs. scheduled scans
- Syscollector: Hardware/software inventory intervals
- Localfile: Which logs to collect and parse
- Docker listener: Container lifecycle events (enabled on 6 hosts)
- Vulnerability detection: OS and package scanning
Example — Kubernetes Group Configuration:
The kubernetes agent does the heavy lifting for cluster security:
<!-- K3s audit log (JSON) -->
<localfile>
  <log_format>json</log_format>
  <location>/var/log/k3s-audit.log</location>
</localfile>

<!-- K8s Warning events (streamed) -->
<localfile>
  <log_format>json</log_format>
  <location>/var/log/k8s-events.log</location>
</localfile>

<!-- Pod status check (every 2 min) -->
<localfile>
  <log_format>full_command</log_format>
  <command>kubectl get pods --all-namespaces -o json | jq ...</command>
  <frequency>120</frequency>
</localfile>

<!-- Container status check (every 2 min) -->
<localfile>
  <log_format>full_command</log_format>
  <command>crictl ps -a -o json | jq ...</command>
  <frequency>120</frequency>
</localfile>
Custom Rules: 100 Rules Across 5 Categories
Every custom rule has a specific ID range and severity level. Severity determines action: level 10+ gets logged prominently, level 13+ triggers email alerts.
Proxmox Rules (100100–100199):
| Rule ID | Event | Level |
|---|---|---|
| 100100-101 | VM/CT start/stop | 5 |
| 100102 | VM migration failure | 10 |
| 100103 | Cluster membership change | 8 |
| 100104-105 | Backup job failed/success | 10/3 |
| 100106 | Storage config change | 7 |
| 100107 | Ceph degradation | 12 |
K3s Audit Rules (100200–100206):
| Rule ID | Event | Level |
|---|---|---|
| 100200 | Secret access/modification | 10 |
| 100201 | Pod deletion | 8 |
| 100202 | RBAC denial (403) | 12 |
| 100203 | Namespace operations | 7 |
| 100204 | Workload changes (deploy/ds/sts) | 5 |
| 100205 | RBAC config changes | 10 |
| 100206 | kubectl exec into pods | 8 |
Kubernetes Container Monitoring (100210–100241):
| Rule ID | Event | Level |
|---|---|---|
| 100211 | OOMKilled | 12 |
| 100212 | CrashLoopBackOff | 10 |
| 100213 | Image pull errors | 8 |
| 100215 | Pod evictions | 10 |
| 100219 | Node not ready | 12 |
| 100240 | Multiple OOMKills (3+ in 10min) | 13 (email!) |
| 100241 | Multiple CrashLoopBackOff (3+ in 5min) | 12 |
Docker Container Monitoring (100250–100256):
| Rule ID | Event | Level |
|---|---|---|
| 100250 | Container start | 5 |
| 100252 | Container died unexpectedly | 10 |
| 100253 | Container OOMKilled | 8 |
| 100255 | Command executed in container | 10 |
| 100256 | Multiple container deaths (3+ in 10min) | 12 |
Homelab Security Rules (100400–100410):
| Rule ID | Event | Level |
|---|---|---|
| 100400/450 | SSH from non-local (suppressed for trusted subnets) | 8/0 |
| 100404 | SSH brute force detection | 10 → Active Response |
| 100405 | New user account creation | 8 |
| 100408 | Disk space exhausted | 12 |
| 100409 | OOM killer triggered | 12 |
| 100410 | Certificate expiration warning | 8 |
Custom Decoders
Seven custom decoders parse non-standard log formats:
proxmox-task    → pvedaemon/pveproxy/pvestatd/pveceph logs
pbs-task        → Proxmox Backup Server proxy/manager logs
k3s-audit       → K3s API server audit events (JSON)
k8s-event       → Kubernetes Warning events from k8s-event-logger
k8s-pod-status  → kubectl pod status JSON output
containerd-status → crictl container status JSON output
opnsense-filterlog → OPNsense packet filter log parsing
Active Response: Automated Threat Mitigation
Wazuh doesn’t just detect — it responds. The active response system implements escalating IP blocking:
SSH Brute Force Response:
Trigger: Repeated failed SSH login attempts
Action: firewall-drop (iptables block)

Escalation: Increasing block durations from minutes to hours
Port Scan: Automatic temporary block
An IP whitelist protects infrastructure hosts (hypervisors, K3s master, Wazuh manager) from accidental self-lockout — a lesson learned the hard way in many SIEM deployments.
K3s Audit Logging
Kubernetes API audit logging captures every request to the K3s API server. The audit policy defines four levels:
| Level | Events |
|---|---|
| None | Health checks, list/watch, system service accounts |
| Metadata | Secret ops, RBAC changes, namespace ops, workload changes |
| RequestResponse | Pod exec/attach/portforward |
| RequestResponse | RBAC modifications |
Implementation:
# WARNING: ~30s API downtime during deployment
ansible-playbook -i inventory.yml playbooks/setup-k3s-audit-logging.yml
The playbook configures K3s with an audit policy file and log rotation (7 days, 100MB max, 3 backups). Wazuh’s kubernetes agent reads /var/log/k3s-audit.log via the custom k3s-audit decoder.
This catches critical events: someone accessing Secrets, RBAC permission denials (potential privilege escalation attempts), unauthorized kubectl exec into pods, and workload modifications.
K8s Container Monitoring
A two-part system provides container-level visibility:
Part 1 — k8s-event-logger (systemd service):
# Streams K8s Warning events in real-time
kubectl get events --all-namespaces \
  --field-selector type!=Normal \
  --watch-only \
  -o json >> /var/log/k8s-events.log
This captures OOMKilled, CrashLoopBackOff, ImagePullBackOff, scheduling failures, and evictions as they happen.
Part 2 — Periodic Status Checks (every 2 minutes):
# Pods with restartCount > 3, waiting containers, or OOMKilled
kubectl get pods --all-namespaces -o json | jq '...'

# Non-running containers via containerd
crictl ps -a -o json | jq '...'
The combination of real-time event streaming and periodic health checks ensures nothing slips through.
Docker Container Monitoring
Six hosts run Docker alongside the Wazuh agent. The Docker listener wodle captures container lifecycle events:
| Host Type | Containers Monitored |
|---|---|
| Web server | Portfolio, chatbot, tunnel, analytics |
| Network | UniFi Controller |
| Security | Password manager |
| Media | Media server |
| Communication | Matrix/Synapse |
| Infrastructure | UPS notification service |
Events tracked: start, stop, die (unexpected), oom, pull, exec_start. An unexpected container death (rule 100252, level 10) gets immediate attention; three deaths in 10 minutes (rule 100256, level 12) indicates a systemic problem.
OPNsense: FreeBSD Agent
OPNsense requires special handling — it’s FreeBSD, not Linux. Deployment uses the native plugin:
System → Firmware → Plugins → os-wazuh-agent → Install
Services → Wazuh Agent → Settings → Manager: <wazuh-ip> → Enable
The custom opnsense-filterlog decoder parses OPNsense’s unique packet filter log format, extracting rule numbers, interfaces, source/destination IPs, and actions.
Email Alerting
Email alerting is configured with a high severity threshold — only critical events (multiple OOMKills in rapid succession, RBAC denials, Ceph degradation, or brute force escalations) trigger email notifications. This prevents warning spam. A daily summary report covers lower-severity events for non-urgent review.
Vulnerability Detection
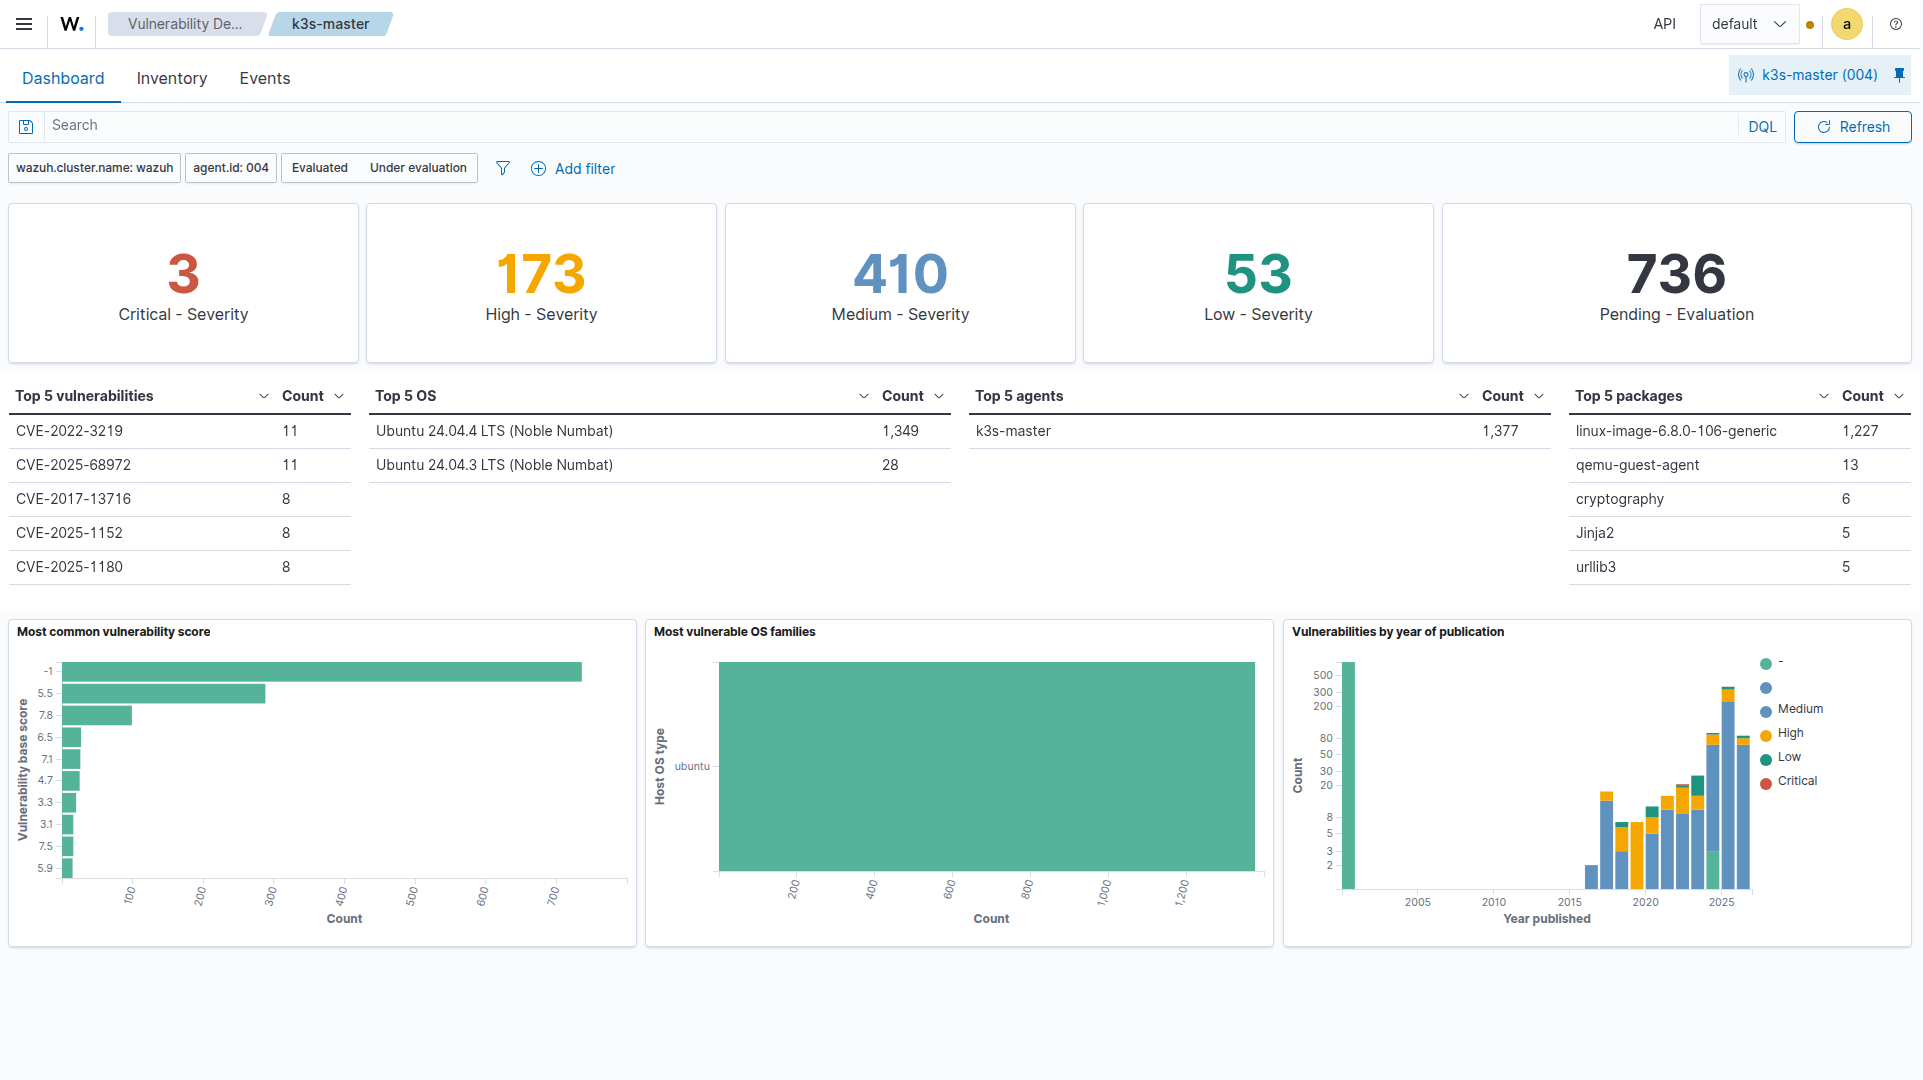
Wazuh scans every agent for known CVEs using package inventory data and vulnerability feeds (updated hourly). The Grafana Vulnerability Deep Dive dashboard visualizes:
- Total CVE count by severity (Critical/High/Medium/Low)
- Top 15 CVEs by affected host count
- Per-host vulnerability breakdown
- CVE trends over time
- Agent keepalive staleness (detecting disconnected agents)
This drives our vulnerability remediation workflow:
# Patch all hosts (rolling update, one at a time)
ansible-playbook -i inventory.yml playbooks/patch-vulnerabilities.yml
Wazuh ↔ Grafana Integration
The bridge between Wazuh and Grafana is a custom Prometheus exporter running on the Wazuh LXC. It queries the Wazuh Manager API and exposes 33 metric families:
Key Metrics Exported:
| Metric | Description |
|---|---|
| wazuh_agents_active | Number of connected agents |
| wazuh_agents_disconnected | Agents that lost connection |
| wazuh_alerts_24h | Alert volume (last 24 hours) |
| wazuh_alerts_by_level | Alerts grouped by severity |
| wazuh_vulnerabilities_by_severity | CVE counts (critical/high/medium/low) |
| wazuh_sca_score | Security Configuration Assessment score per agent |
| wazuh_mitre_tactic_count | MITRE ATT&CK tactic distribution |
| wazuh_fim_entries | File integrity monitoring file count |
| wazuh_active_response_24h | Automated blocks in last 24 hours |
| wazuh_agent_keepalive_age_seconds | Agent staleness indicator |
Three Dedicated Dashboards:
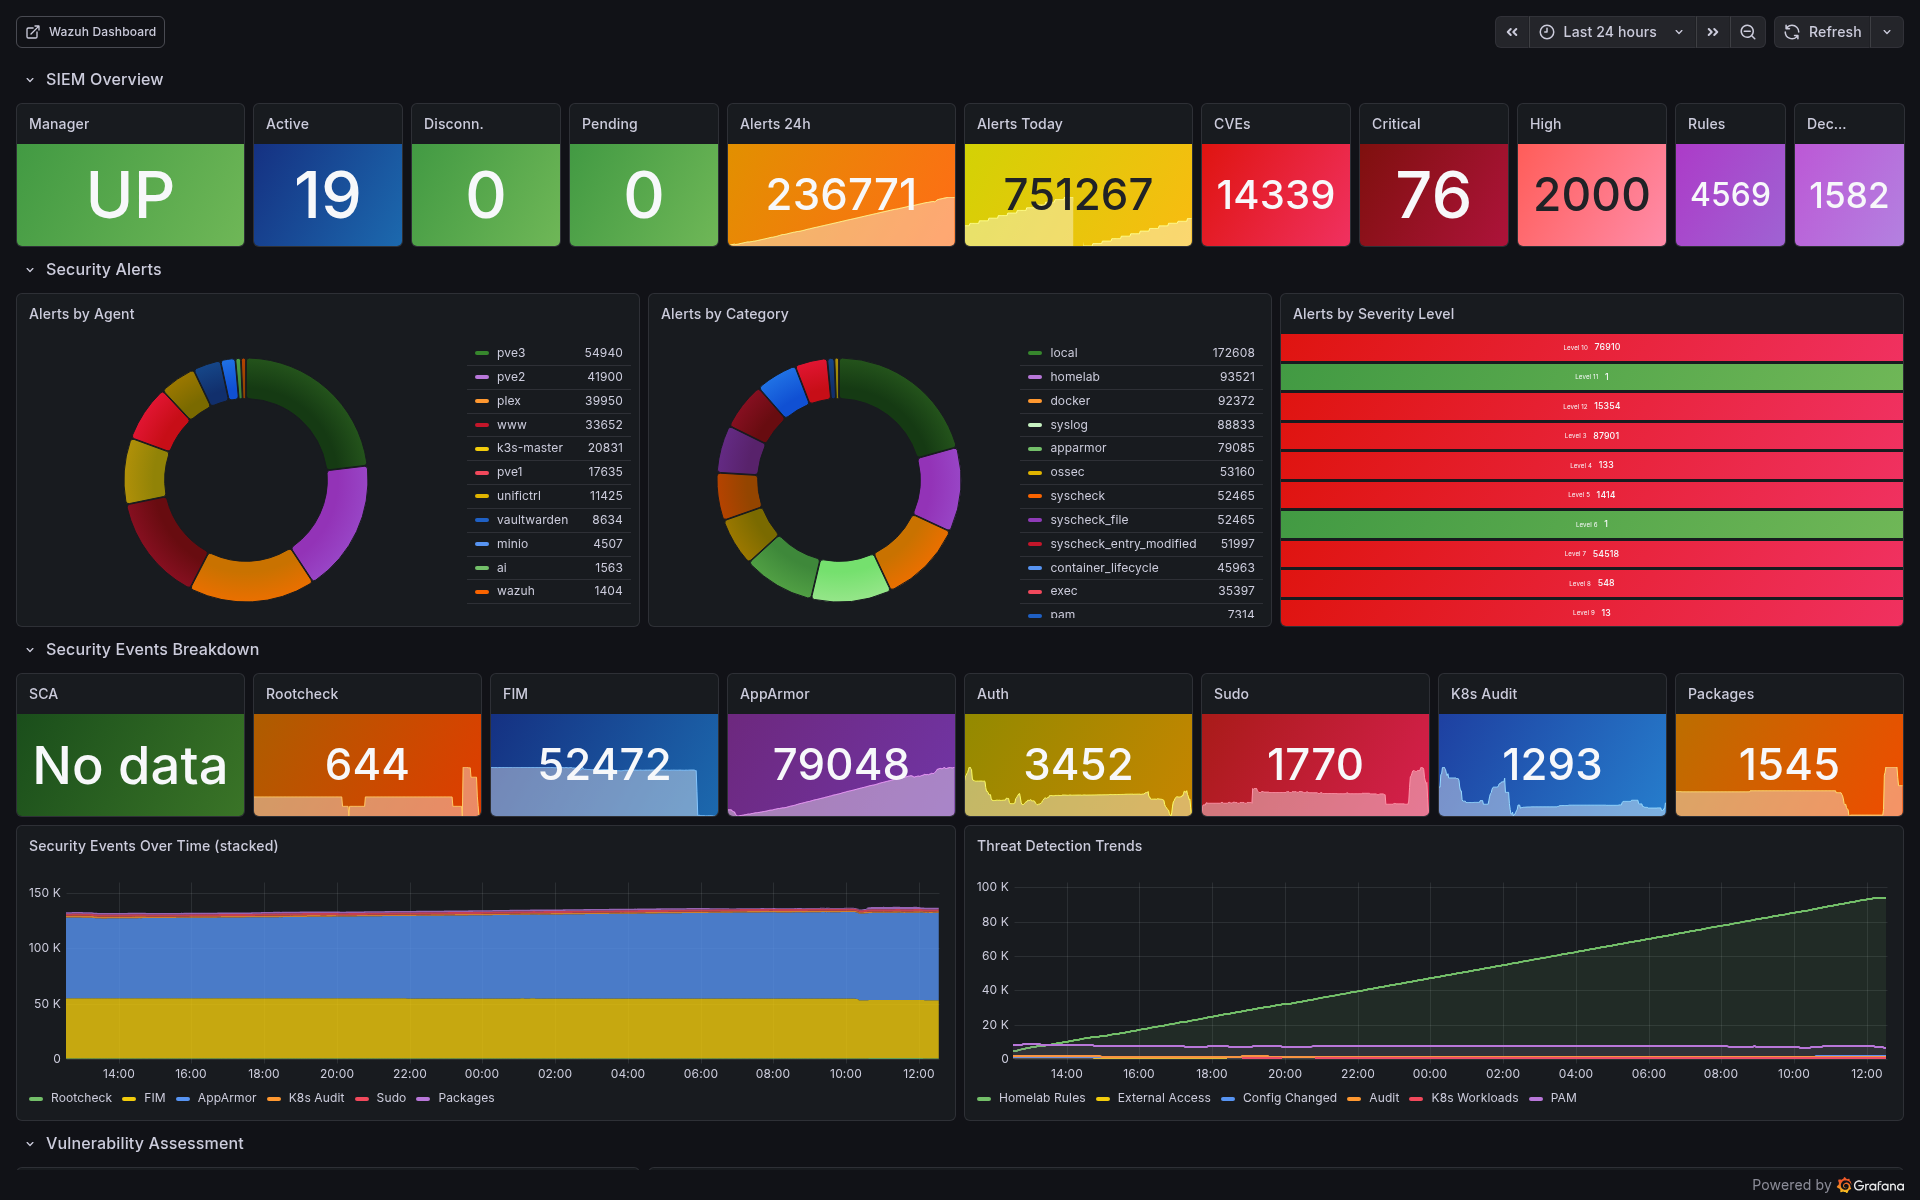
1. Wazuh SIEM Dashboard (uid: wazuh-siem)
- SIEM Overview: Manager status, agent counts, 24h alert volume
- Security Alerts: By agent (pie), by category (pie), by severity
- Events Breakdown: SCA, Rootcheck, FIM, AppArmor, K8s Audit stats
- Vulnerability Assessment: Severity distribution, per-host CVE bars
- Agent Fleet: Status grid (online/offline), OS distribution
- Trends: Alert rate, agent fleet, FIM entries over time
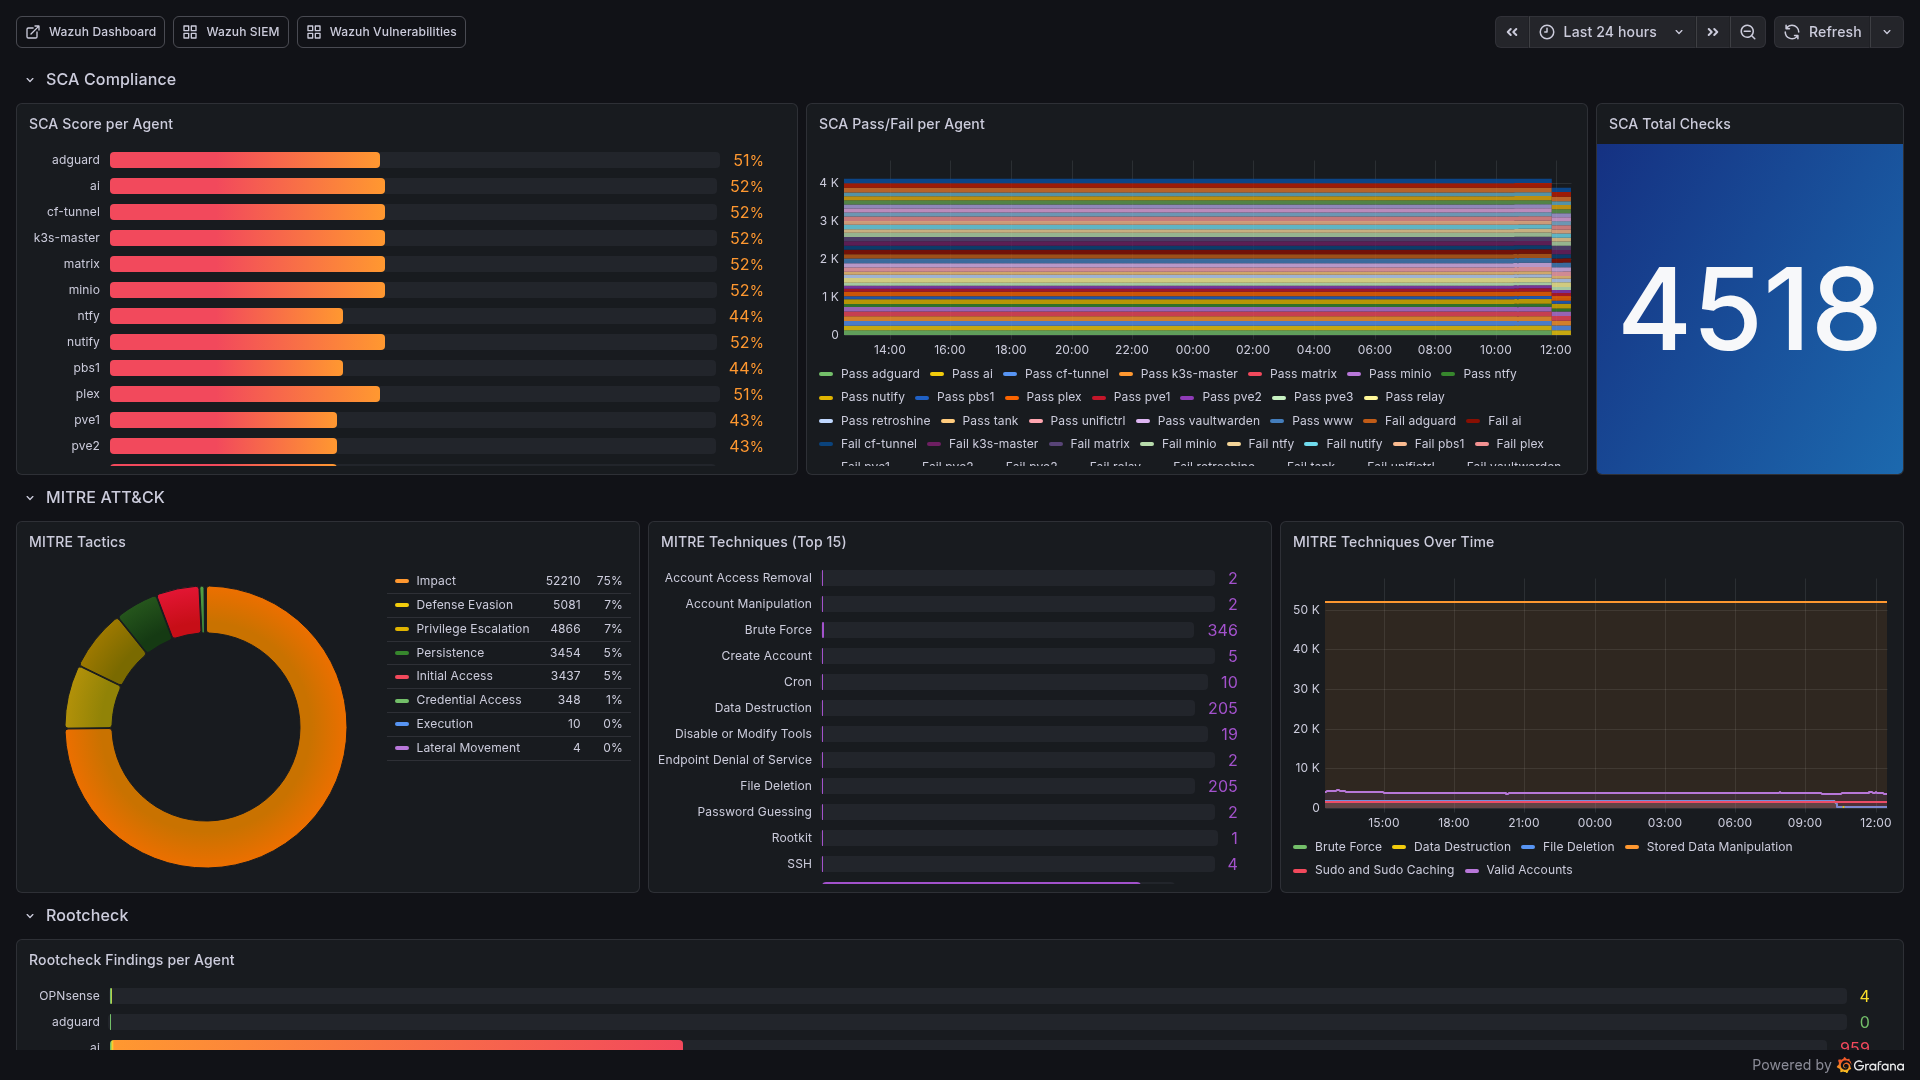
2. Wazuh Compliance & Threats (uid: wazuh-compliance)
- SCA Compliance: Score per agent (bar gauge), pass/fail breakdown
- MITRE ATT&CK: Tactic distribution, top 15 techniques, trends
- Authentication: Success/failed counters, active response count
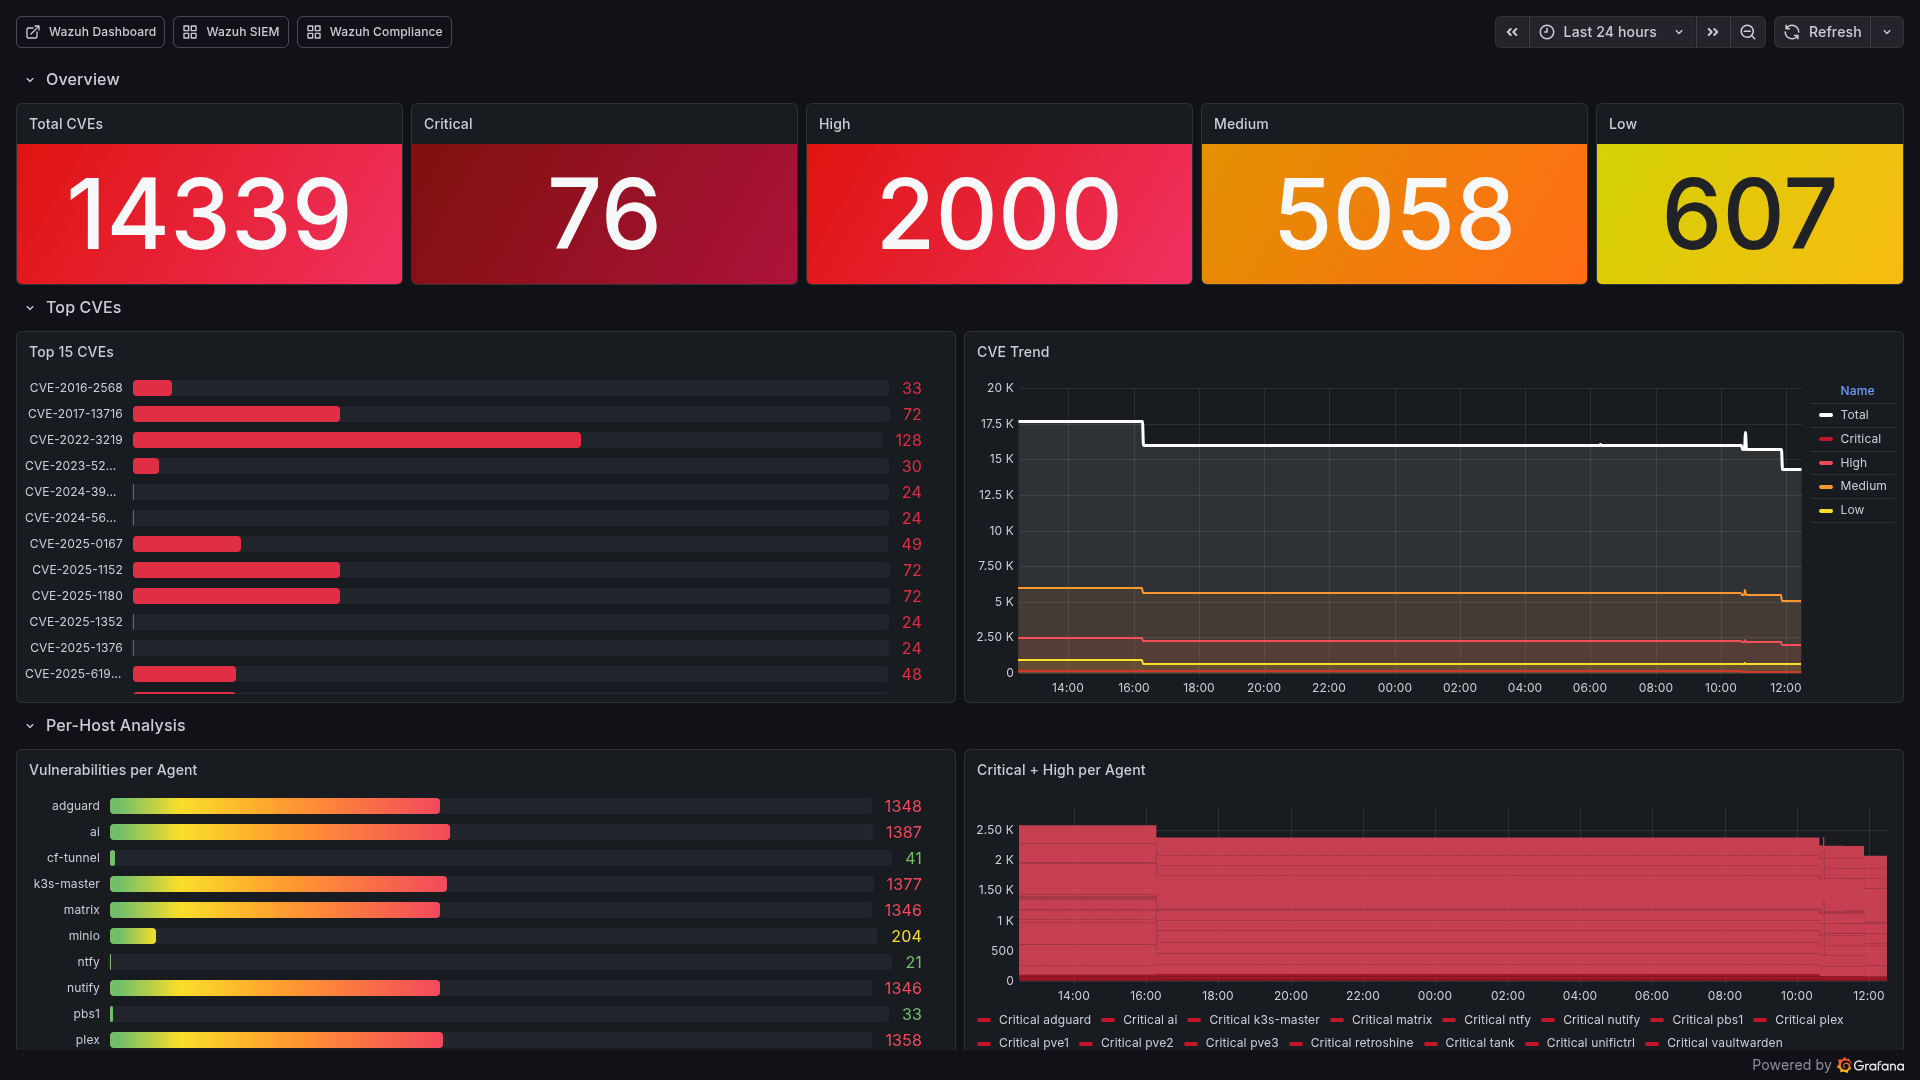
3. Wazuh Vulnerability Deep Dive (uid: wazuh-vulns)
- Total CVEs with critical/high/medium/low breakdown
- Top 15 CVEs by count
- Per-host analysis with severity breakdown
- Agent health via keepalive age
The Complete Data Flow

Lessons Learned
1. Inhibition rules are non-negotiable. Without them, a single host going down generates 5+ alerts (host down + services down + probes failing). With inhibition, you get one alert.
2. Separate critical from noise early. Wazuh’s email threshold at level 13 and Alertmanager’s critical/warning split prevent alert fatigue. If everything is urgent, nothing is.
3. Single-binary Loki is perfect for homelabs. The microservices deployment mode is overkill. Single-binary with 14-day retention on local storage handles everything a homelab needs.
4. Custom decoders make or break Wazuh. Out-of-the-box Wazuh doesn’t understand Proxmox, K3s audit, or OPNsense logs. Seven custom decoders were needed to make the data useful.
5. Active response needs a whitelist. Without one, Wazuh’s SSH brute force blocking will eventually block your management IPs. The whitelist for PVE hosts and K3s master prevents self-lockout.
6. GitOps dashboards > manual dashboards. ConfigMap-based Grafana dashboards survive pod restarts, are version-controlled, and deploy automatically. Never create dashboards through the UI in production.
7. The Prometheus exporter bridge is worth building. Wazuh’s native dashboard is great for investigation, but Grafana provides the unified view. A custom exporter bridging the two gives you the best of both worlds.
8. Monitor the monitoring. Dedicated alerts for LokiDown, PromtailDown, WazuhManagerDown, WazuhAgentDisconnected, and PbsExporterDown ensure the observability stack itself stays healthy.
Built With Claude Code
The entire monitoring and SIEM stack — all Ansible playbooks, Helm values, custom rules, decoders, dashboards, exporters, and alert configurations — was built using Claude Code (Claude Opus).
My role: Architect defining requirements, reviewing outputs, and making security decisions.
Claude’s execution:
- 1,596-line Helm values.yaml with 42 scrape targets and 52 alert rules
- 100+ Wazuh custom rules with proper severity levels and escalation
- 7 custom decoders for non-standard log formats
- 33 Grafana dashboard ConfigMaps with PromQL queries
- 8 exporter Kustomize deployments with proper resource limits
- Ansible playbooks for automated agent deployment across Linux, FreeBSD, and Windows
- ntfy-bridge Python service for mobile push notifications
- Shell scripts for external monitoring agent installation
This is infrastructure-as-code at scale — the kind of work that would take weeks manually, delivered in days with AI-assisted development.
What’s Next
Shipped:
- 42 Prometheus targets covering all infrastructure
- 22 Wazuh agents with specialized group configs
- 52 custom alert rules with inhibition
- 33 Grafana dashboards
- Multi-tier alerting (email + ntfy)
- Active response (SSH brute force, port scan blocking)
- Restore testing automation (
verify-backup.sh— monthly random VM restore from PBS, boot verification, auto-cleanup, ntfy alerts) - Server closet sensor (LoRaWAN sensors for temperature, humidity, CO2, VOC via ChirpStack MQTT exporter)
- UPS auto-shutdown orchestration (NUT client on all PVE hosts, graceful shutdown on LOWBATT, ntfy notifications)
- Incident Timeline dashboard (alert correlation, Loki error logs, ArgoCD deploy tracking, system resources)
Roadmap:
- Server room sensor: LoRaWAN sensor in the server closet measuring temperature, humidity (and depending on model CO2/VOC), displayed via ChirpStack → MQTT Exporter → Prometheus → Grafana
The Stack (Complete Reference)
| Layer | Technology |
|---|---|
| Metrics | Prometheus (kube-prometheus-stack Helm, 15d retention) |
| Visualization | Grafana (33 custom + 10 community dashboards) |
| Logs | Loki single-binary (14d retention, 10Gi storage) |
| Log Shipping | Promtail (K3s DaemonSet + 4 external agents) |
| SIEM | Wazuh 4.14.3 All-in-One (LXC, 22 agents, 8 groups) |
| Alerting | Alertmanager → Email (critical) + ntfy (all) |
| Host Metrics | node_exporter on 7 hosts + OPNsense plugin |
| Proxmox | pve-exporter (API scrape, cluster mode) |
| Backup Monitoring | pbs-exporter (Proxmox Backup Server) |
| Network | UniFi Poller + SNMP Exporter (switch, TrueNAS) |
| UPS | NUT Exporter (Eaton Ellipse PRO 850) |
| DNS | AdGuard Exporter |
| Probing | Blackbox Exporter (21 ICMP, 12 HTTP, DNS, SMTP) |
| Disk Health | smartctl_exporter on pve3 |
| Bandwidth | Speedtest Exporter (4h intervals) |
| GPU | DCGM Exporter (NVIDIA RTX 3060, 15s scrape) |
| LoRaWAN | ChirpStack MQTT Exporter |
| Security Rules | 100+ custom Wazuh rules (IDs 100100–100499) |
| Active Response | SSH brute force + port scan blocking with escalation |
| Vulnerability | Wazuh CVE scanning + Grafana deep-dive dashboard |
| Deployment | Ansible (Wazuh) + Helm/Kustomize (K8s) |
| Ingress | Traefik (internal) + Cloudflare Tunnel (external) |
| TLS | cert-manager with Cloudflare DNS-01 wildcard |
| Infrastructure | Proxmox → Ubuntu 24.04 → K3s single-node |